Or, at least, our firms are. Figure 1 plots the share of employment accounted for by "old" firms--6 years or older and 11 years or older (click for larger image). These data are from the BDS, which includes the universe of private, nonfarm establishments (but I look at firm characteristics).
Note that the 6+ category includes the 11+ category. Observe that old firms account for a large majority of employment. Further, their share has been steadily increasing, with the 11+ category gaining by about 10 percentage points in the last two decades (the decline of young firms has been well documented, e.g., here). I've noted before that startups basically account for all net job creation, but these data are reminders that older firms employ most of us. It's basically a stocks and (net) flows distinction.
Figure 2 plots the share of employment accounted for by what we might call medium or large firms--50 or more employees and 250 or more employees (click for larger image).
These size categories account for the majority of employment, with just over half of all private nonfarm employment being accounted for by firms with 250 or more employees. This fact seems like an important one to keep in mind when politicians talk about small businesses. Note that, as with old firms, large firms have increased their share of employment in recent decades. Observe also that there is a cyclical element to the size distribution of employment (which is discussed at length by Moscarini and Postel-Vinay; this is a very interesting paper).
Despite this post's title, I don't mean to suggest that the changing age and size distribution of firms is a bad thing. It may or may not be. But it does seem noteworthy. It's also useful to keep the following distinction in mind:
Just for fun, I also diced the size distribution to look at really large firms. Figure 3 plots the share of employment accounted for by firms with 5,000+ and 10,000+ employees.
About a quarter of all private, nonfarm employees work for a few huge, 10,000-worker firms (about 1,200 firms in 2010, with 640,000 establishments). These size categories show strong cyclical patterns and, perhaps, some elements of the usual upward secular trend.
The relationships between labor markets and the size and age distribution of firms appear to have both secular and cyclical components. Rates of job creation, job destruction, and excess reallocation tend to decline as size and age increase, so the secular trends in employment shares charted here may help explain the secular trends we see in those measures of job market dynamism, somewhat counteracting the movement towards higher-volatility industries.![]()
 |
| Figure 1 Vertical axis does not start at zero |
Note that the 6+ category includes the 11+ category. Observe that old firms account for a large majority of employment. Further, their share has been steadily increasing, with the 11+ category gaining by about 10 percentage points in the last two decades (the decline of young firms has been well documented, e.g., here). I've noted before that startups basically account for all net job creation, but these data are reminders that older firms employ most of us. It's basically a stocks and (net) flows distinction.
Figure 2 plots the share of employment accounted for by what we might call medium or large firms--50 or more employees and 250 or more employees (click for larger image).
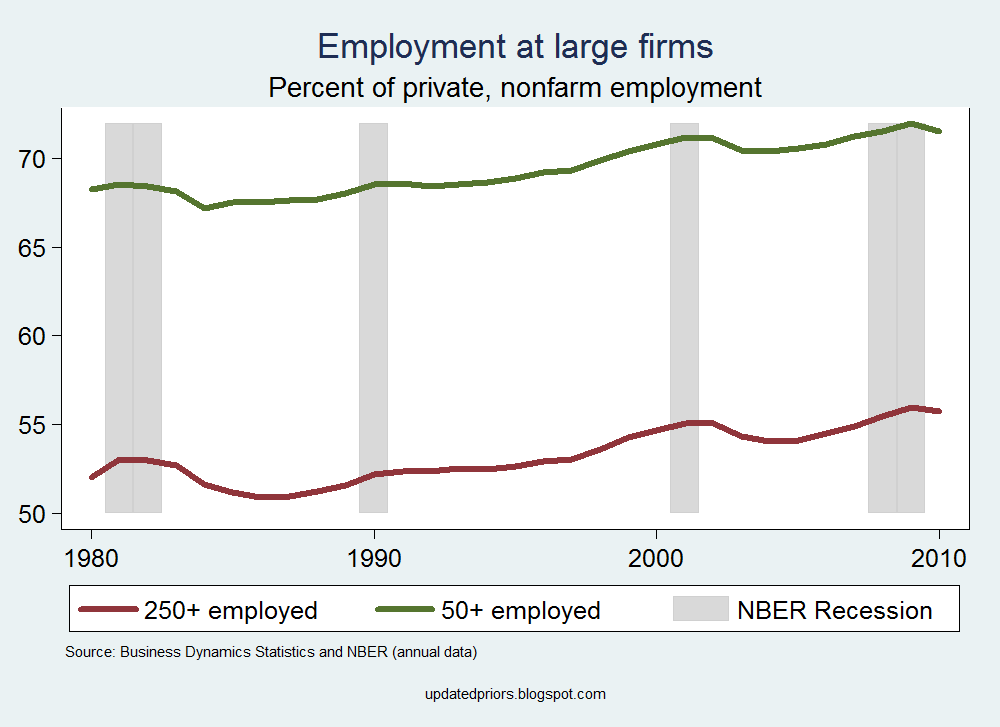 |
| Figure 2 Vertical axis does not start at zero |
These size categories account for the majority of employment, with just over half of all private nonfarm employment being accounted for by firms with 250 or more employees. This fact seems like an important one to keep in mind when politicians talk about small businesses. Note that, as with old firms, large firms have increased their share of employment in recent decades. Observe also that there is a cyclical element to the size distribution of employment (which is discussed at length by Moscarini and Postel-Vinay; this is a very interesting paper).
Despite this post's title, I don't mean to suggest that the changing age and size distribution of firms is a bad thing. It may or may not be. But it does seem noteworthy. It's also useful to keep the following distinction in mind:
While large and mature businesses account for a very large share of the level of economic activity, the dynamics of entry and exit and the associated dynamics of young and small businesses account for a disproportionate share of the change in activity. (Becker, et al. 2006, 544)
Just for fun, I also diced the size distribution to look at really large firms. Figure 3 plots the share of employment accounted for by firms with 5,000+ and 10,000+ employees.
 |
| Figure 3 Vertical axis does not start at zero |
About a quarter of all private, nonfarm employees work for a few huge, 10,000-worker firms (about 1,200 firms in 2010, with 640,000 establishments). These size categories show strong cyclical patterns and, perhaps, some elements of the usual upward secular trend.
The relationships between labor markets and the size and age distribution of firms appear to have both secular and cyclical components. Rates of job creation, job destruction, and excess reallocation tend to decline as size and age increase, so the secular trends in employment shares charted here may help explain the secular trends we see in those measures of job market dynamism, somewhat counteracting the movement towards higher-volatility industries.