Part I, in which I sliced the data by state, is here. The state-level approach has some nice intuitive appeal, but in general I don't think state lines are always great ways to divide economic activity (but they do have a few advantages since they make their own laws).
This time I'll look at Metropolitan Statistical Areas, or cities (data for these are now available in the newest vintage of the BDS; other city definitions, like commuting zones, are not). The nice thing about MSAs is that they can cross state lines; for example, Washington, DC includes parts of Virginia and Maryland. Philadelphia includes parts of Delaware and New Jersey. MSAs are county based; that is, an MSA is a collection of counties. The BDS uses 2009 definitions, provided here (the definitions can change over time, but for time series work we need constant definitions). I'll also briefly look at one region that does not map to a single MSA, Silicon Valley.
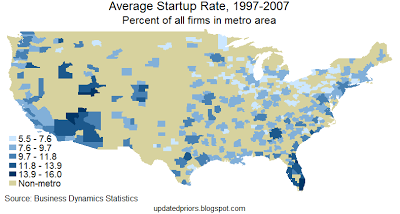
Figure 1 (click for larger image) plots startup rates by MSA (actually, the map template is for counties, so the MSA dividers aren't always ideal--sorry). I have used the average of the 10-year period of 1997-2007, hoping to avoid cyclical issues. Darker means higher startup rates, where the startup rate is the percent of all MSA firms that are startups (new firms). From my post on state-level startup rates, some of this is unsurprising (e.g., high startup rates in Utah and Florida). Note that this is a within-city measure of startup activity; it says nothing about how significant is the city's contribution to national startup activity, but it does say something about the nature of firm dynamics within a city. Figure 2 shows the top 10 cities for internal startup activity (click for larger image):
![]()
This time I'll look at Metropolitan Statistical Areas, or cities (data for these are now available in the newest vintage of the BDS; other city definitions, like commuting zones, are not). The nice thing about MSAs is that they can cross state lines; for example, Washington, DC includes parts of Virginia and Maryland. Philadelphia includes parts of Delaware and New Jersey. MSAs are county based; that is, an MSA is a collection of counties. The BDS uses 2009 definitions, provided here (the definitions can change over time, but for time series work we need constant definitions). I'll also briefly look at one region that does not map to a single MSA, Silicon Valley.
 |
| Figure 1 |
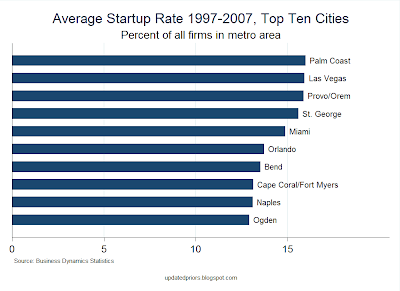
Figure 1 (click for larger image) plots startup rates by MSA (actually, the map template is for counties, so the MSA dividers aren't always ideal--sorry). I have used the average of the 10-year period of 1997-2007, hoping to avoid cyclical issues. Darker means higher startup rates, where the startup rate is the percent of all MSA firms that are startups (new firms). From my post on state-level startup rates, some of this is unsurprising (e.g., high startup rates in Utah and Florida). Note that this is a within-city measure of startup activity; it says nothing about how significant is the city's contribution to national startup activity, but it does say something about the nature of firm dynamics within a city. Figure 2 shows the top 10 cities for internal startup activity (click for larger image):
 |
| Figure 2 |
These are mostly small cities. Interestingly, Florida has five of the top ten (Palm Coast, Miami, Orlando, Cape Coral/Fort Myers, and Naples). Utah has three of the top ten (Provo/Orem, St. George, and Ogden). In all of the top ten, 12 to 15 percent of all firms are startups in a given year (on average for the 10-year period).
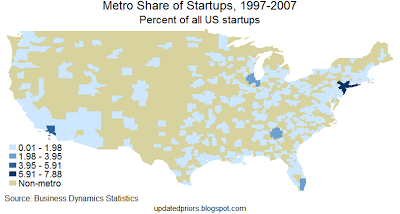
In my state-level post, I found that California, Florida, New York, and Texas are the top contributors to national startup activity. Are the top startup cities in those states? Figure 3 shows cities' share of national startups; that is, I sum all startups in the city for 1997-2007 then divide it by all startups for the US for 1997-2007 (click for larger image).
In my state-level post, I found that California, Florida, New York, and Texas are the top contributors to national startup activity. Are the top startup cities in those states? Figure 3 shows cities' share of national startups; that is, I sum all startups in the city for 1997-2007 then divide it by all startups for the US for 1997-2007 (click for larger image).
 |
| Figure 3 |
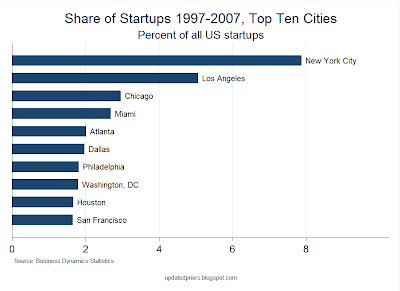
Few cities are significant contributors to national startup activity. Observe that, despite the state's large contribution to startup activity, Texas has no large contributing cities. The big contributors can be clearly seen on the map: New York City, Chicago, Miami, and Los Angeles (Atlanta shows up, but it is just barely above several other cities; I chose the cutoffs poorly). Figure 4 shows the top ten cities for contribution to national totals (click for larger image):
 |
| Figure 4 |
Despite New York only being the #3 state, New York City contributes an astounding 8 percent of startups in the US. This breakdown shows the value of looking at cities instead of states. In my state-level analysis, Texas earned its place high on this list--but here we learn that both California and Texas have lots of cities with moderate contributions (plus one big city for California), whereas New York City actually provides more startup activity than New York State. The chart also shows that Washington DC does its part for startup activity, but this could not show up in state-level analysis (treating DC as a state is always odd). In any case, the utility of examining cities that cross state lines is shown here.
An aside on Silicon Valley: According to this BLS document, Silicon Valley doesn't map to a specific MSA but instead includes counties in the San Francisco, San Jose, and Santa Cruz MSAs. Unfortunately, the BDS does not provide county-level data. An upper bound can be obtained by looking at all three MSAs as a group. Using this definition, I found that Silicon Valley accounts for 2.45 percent of national startups, placing it below Miami (2.69 percent) and above Atlanta (2.01 percent). That's a respectable quantity, but it may be smaller than some would expect. Of course, not all startups are created equal, and it's possible that growth-weighted data would look different.
Finally, as with my state analysis, my city analysis shows that some areas are increasing their startup activity faster than others. Figure 5 shows the change in share of national startup activity by MSA from the average of the 1987-89 period to the 2004-06 period (click for larger image):
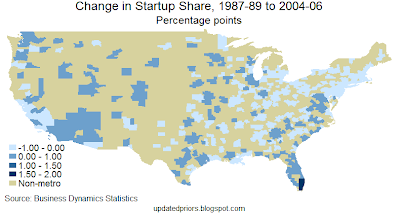 |
| Figure 5 |
Florida consistently shows itself to be a hotbed of startup activity with positive growth in its share, increasing its share of national activity by more than 1.5 percentage points. Many cities show positive growth, which is not surprising given the shift of economic activity from rural to urban areas. Figure 6 shows the share of startup activity accounted for by metropolitan areas (as opposed to non-metropolitan areas) since 1978 (click for larger image):
 |
| Figure 6 |
Metro areas accounted for around 80 percent of startups in 1980 but now account for more than 86 percent. This trend shows no signs of abating.
I think the above analysis shows a few things.
First, common perceptions about the concentration of startup activity may be flawed; I wonder who among startup enthusiasts would have predicted that Miami and Chicago produce more startups than Silicon Valley. But this is a very general definition of startup that includes everything from the new local dentist to the next Google; things may be different if we use a more fashionable definition.
Second, there is a difference between having startup activity that is quantitatively significant in national terms and having startup activity that is quantitatively significant in local terms. Both tell us something about cities. Some places are both highly dynamic in a local sense and important for national activity (e.g., Florida), while others may lack national significance but clearly have strong startup activity as a share of the local economy (e.g., several Utah cities). Still other regions contribute much to national activity by nature of the fact that they are large economies, but startups are not a large share of local activity.
Third, the way we slice geography matters; some of the results from this analysis of metropolitan areas are surprising in light of my previous analysis of states, and I suspect that dividing cities up in different ways (e.g., commuting zones) could provide other surprises as well. There are also strong implications of industry trends for this kind of analysis, since industry and geography are closely linked. The broader point is that the way we aggregate matters.
Finally, it's important to keep in mind that this regional activity is occurring against the backdrop of a secular decline in startup activity (see charts here). Further, I have not here examined the job market implications of this; we know that startups basically account for all net job creation, and I haven't here looked at how that fact interacts with geography.