From the BLS:
I like this data series, with some caveats.* If you're not familiar with this series, note that gross flows are large relative to net flows. Roughly speaking, think of the Great Recession as involving about 8.5 million net job losses. Entering and expanding business establishments create at least half that many jobs even in terrible quarters, but a recession is characterized by even larger numbers of jobs being destroying by shrinking or closing establishments.
I like to slice the data by extensive margin (opening or closing business establishments) and intensive margin (expanding or contracting business establishments). Figure 1 reports the flows of employment associated with opening and closing establishments, and Figure 2 reports actual numbers of establishments that opened or closed (click for larger images).
New establishments continue to boost net employment, keeping positive job flows ahead of closures for several quarters in a row. The latest quarter shows a slight uptick in gross flows of establishments, which many might consider to be a positive sign. But in general, total reallocation on the establishment extensive margin has been pretty constant since the end of the recession.
I would say that these numbers look promising. Establishment growth is helping drive employment recovery, and shrinking establishments are providing less "drag" over time. Total reallocation seems to be trending upward as well, so in my view these data look reasonably good.
*The BED are quarterly data provided from the BLS based on state UI data. They are released with a lag of about 8 months. Like the BDS (the dataset I usually use here), the BED basically covers the universe of private nonfarm employers; unlike the BDS, the BED is available at higher frequency and is released more quickly. BED has other drawbacks compared to the BDS, such as a more limited ability to track firms.
The BLS effectively expanded the sample definition in the first quarter of 2013, and it does not appear that they have done anything to fix the time series. This is very unfortunate as it limits the usefulness of looking at time series in ways that are difficult to fully grasp. The 2013q1 observation was the most obviously affected, as it reported all establishments that were added to the sample as establishment openings. For openings data, I have replaced the 2013q1 observation with the average of 2012q4 and 2013q2. I haven't dug into the data enough to know whether users can manually correct for this over the longer run. See BLS discussion here, on the bottom of the page ("Administrative Change Affecting..."). Please, BLS, do something about these time series.
It is also important to note that these numbers are seasonally adjusted, and any guess at net numbers based on the difference between two seasonally adjusted series is very, very rough. Non-SA numbers are available on the BLS website.
These numbers track business establishments, which are different from firms. Costco is a firm; your local Costco store is an establishment. Most firms consist of only one establishment. The BED is not ideal for tracking firms, as it has limited ability to correctly link establishments to the firm level.![]()
From September 2013 to December 2013, gross job gains from opening and expanding private sector establishments were 7.3 million, an increase of 290,000 jobs from the previous quarter. . . . Gross job losses from closing and contracting private sector establishments were 6.5 million, a decrease of 34,000 jobs from the previous quarter.
I like this data series, with some caveats.* If you're not familiar with this series, note that gross flows are large relative to net flows. Roughly speaking, think of the Great Recession as involving about 8.5 million net job losses. Entering and expanding business establishments create at least half that many jobs even in terrible quarters, but a recession is characterized by even larger numbers of jobs being destroying by shrinking or closing establishments.
I like to slice the data by extensive margin (opening or closing business establishments) and intensive margin (expanding or contracting business establishments). Figure 1 reports the flows of employment associated with opening and closing establishments, and Figure 2 reports actual numbers of establishments that opened or closed (click for larger images).
 |
| Figure 1 |
 |
| Figure 2 |
Next, the intensive margin. Figure 3 reports employment flows from expanding and contracting establishments, and Figure 4 reports establishment counts for these categories (click for larger images).
 |
| Figure 3 |
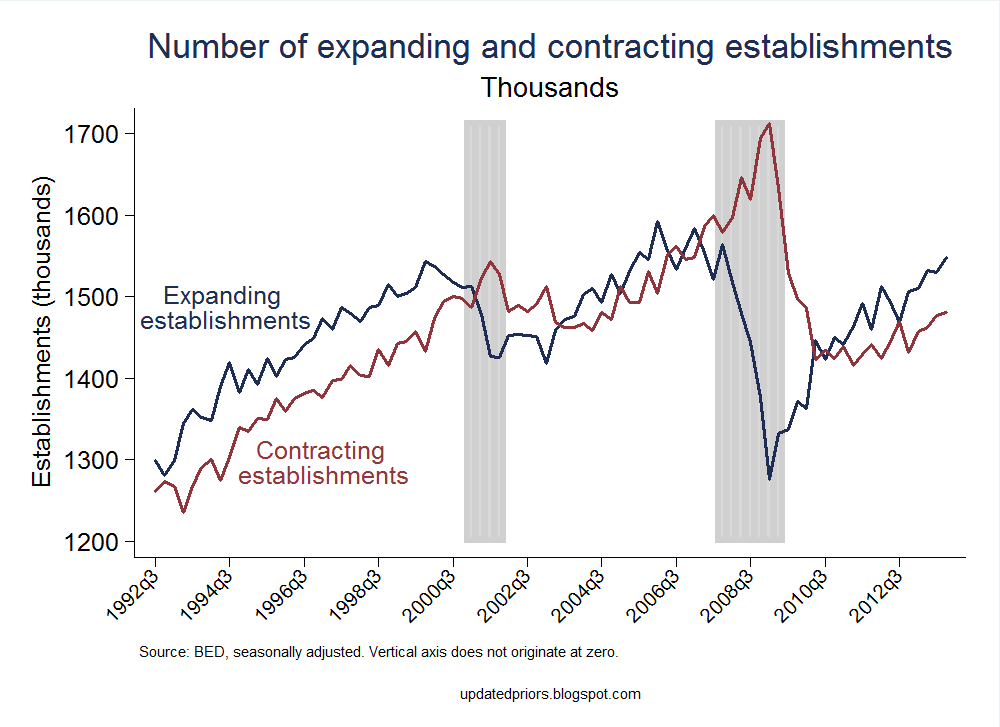 |
| Figure 4 |
I would say that these numbers look promising. Establishment growth is helping drive employment recovery, and shrinking establishments are providing less "drag" over time. Total reallocation seems to be trending upward as well, so in my view these data look reasonably good.
Overall, this is a pretty good report.
Now some usual thoughts: gross flows give us an idea of where jobs are being created and destroyed, which fleshes out the net job numbers that are more popular (and timely). For policymakers, it matters whether job market problems are being driven by establishment turnover or job flows in existing establishments. In my (hasty) view, these latest numbers suggest that both margins are firing reasonably well, which was less the case a few quarters ago. Further, my prior is that the slight upward trend in total reallocation among continuing establishments is a good sign and may boost productivity somewhat.
More broadly, these data help dissuade us from thinking in representative agent terms, which is what the net numbers incline people to do. It's tempting to think that net numbers tell us about the experience of most businesses, but in reality there is a lot of heterogeneity among firms and reallocation proceeds at a high pace. In my view this complicates macro analysis somewhat, rendering simple "aggregate demand/supply" heuristics somewhat tricky.
Some previous BED posts are here.
*The BED are quarterly data provided from the BLS based on state UI data. They are released with a lag of about 8 months. Like the BDS (the dataset I usually use here), the BED basically covers the universe of private nonfarm employers; unlike the BDS, the BED is available at higher frequency and is released more quickly. BED has other drawbacks compared to the BDS, such as a more limited ability to track firms.
The BLS effectively expanded the sample definition in the first quarter of 2013, and it does not appear that they have done anything to fix the time series. This is very unfortunate as it limits the usefulness of looking at time series in ways that are difficult to fully grasp. The 2013q1 observation was the most obviously affected, as it reported all establishments that were added to the sample as establishment openings. For openings data, I have replaced the 2013q1 observation with the average of 2012q4 and 2013q2. I haven't dug into the data enough to know whether users can manually correct for this over the longer run. See BLS discussion here, on the bottom of the page ("Administrative Change Affecting..."). Please, BLS, do something about these time series.
It is also important to note that these numbers are seasonally adjusted, and any guess at net numbers based on the difference between two seasonally adjusted series is very, very rough. Non-SA numbers are available on the BLS website.
These numbers track business establishments, which are different from firms. Costco is a firm; your local Costco store is an establishment. Most firms consist of only one establishment. The BED is not ideal for tracking firms, as it has limited ability to correctly link establishments to the firm level.