Or, job market second moments.
Today the BLS released new BED numbers (I've covered these before), which now go through the second quarter of 2013. Said the BLS:
This release also included some delayed annual revisions. Here are some very important footnotes.*
Readers who aren't familiar with gross job numbers should pay attention to magnitudes. More than 7 million jobs were created during a single quarter; and 6.5 million jobs were destroyed. For comparison, the Great Recession was characterized by the net destruction of about 8.5 million jobs, total, between late 2007 and late 2009 (private sector). As you can see, job flows from reallocation absolutely dwarf the net job numbers that make headlines. The US economy is a reallocation machine. However, the rate of reallocation has been slowing, a fact I've mentioned about a million times so I'll spare you the links.
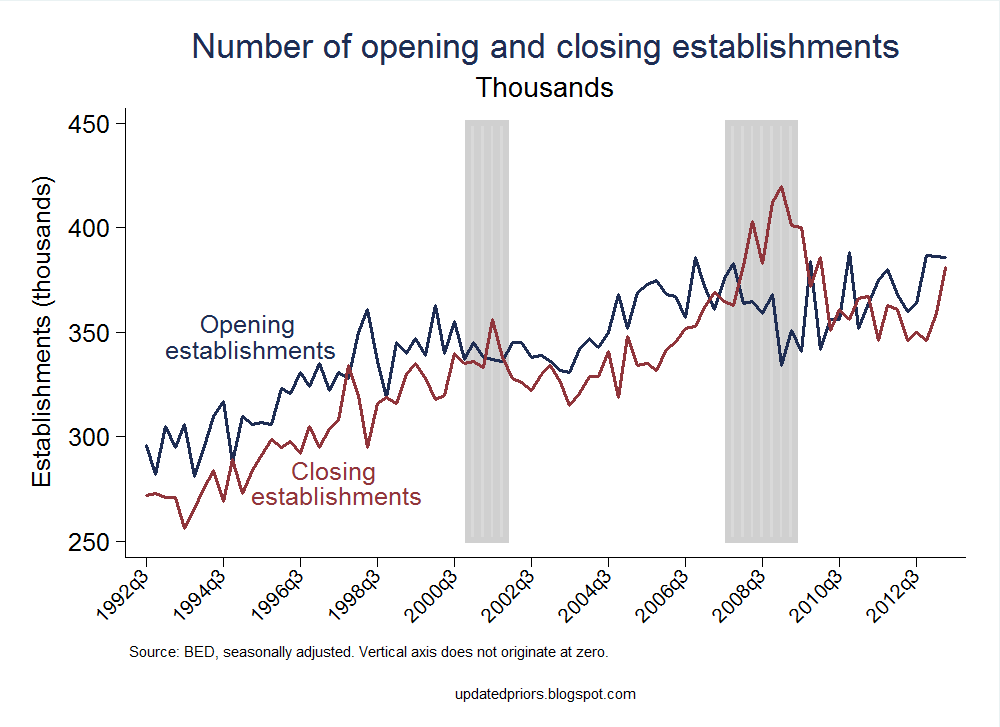
I like to separate these numbers into extensive margin (opening or closing business establishments) and intensive margin (expanding or contracting business establishments). First, extensive: Figure 1 reports the flows of employment associated with opening and closing establishments, and Figure 2 reports actual numbers of establishments that opened or closed (click for larger images).
Opening establishments seem to be doing a decent job of keeping employment demand ahead of jobs destroyed by establishments closures, maintaining that gap that opened up in late 2011. The new establishment count for 2013q2 looks unhelpful.
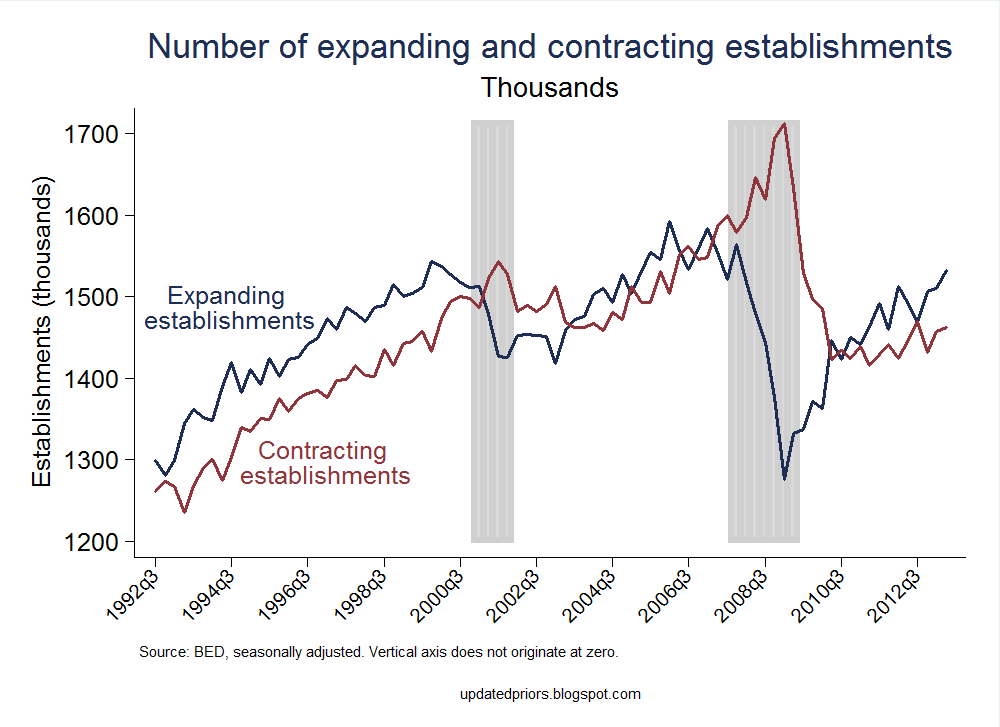
Now look at intensive margins; Figure 3 reports employment flows from expanding and contracting establishments, and Figure 4 reports establishment counts for these categories (click for larger images).
I would say that these numbers look promising, with all the usual caveats. But I would feel better if the entry/exit numbers looked as good as the expansion/contraction numbers.
![]()
Today the BLS released new BED numbers (I've covered these before), which now go through the second quarter of 2013. Said the BLS:
From March 2013 to June 2013 gross job gains from opening and expanding private sector establishments were 7.1 million, the U.S. Bureau of Labor Statistics reported today. Over this period, gross job losses from closing and contracting private sector establishments were 6.5 million, an increase of 191,000 from the previous quarter.
This release also included some delayed annual revisions. Here are some very important footnotes.*
Readers who aren't familiar with gross job numbers should pay attention to magnitudes. More than 7 million jobs were created during a single quarter; and 6.5 million jobs were destroyed. For comparison, the Great Recession was characterized by the net destruction of about 8.5 million jobs, total, between late 2007 and late 2009 (private sector). As you can see, job flows from reallocation absolutely dwarf the net job numbers that make headlines. The US economy is a reallocation machine. However, the rate of reallocation has been slowing, a fact I've mentioned about a million times so I'll spare you the links.
I like to separate these numbers into extensive margin (opening or closing business establishments) and intensive margin (expanding or contracting business establishments). First, extensive: Figure 1 reports the flows of employment associated with opening and closing establishments, and Figure 2 reports actual numbers of establishments that opened or closed (click for larger images).
 |
| Figure 1 |
 |
| Figure 2 |
Opening establishments seem to be doing a decent job of keeping employment demand ahead of jobs destroyed by establishments closures, maintaining that gap that opened up in late 2011. The new establishment count for 2013q2 looks unhelpful.
Now look at intensive margins; Figure 3 reports employment flows from expanding and contracting establishments, and Figure 4 reports establishment counts for these categories (click for larger images).
 |
| Figure 3 |
 |
| Figure 4 |
I would say that these numbers look promising, with all the usual caveats. But I would feel better if the entry/exit numbers looked as good as the expansion/contraction numbers.
I like to keep an eye on these numbers for several reasons. Any sort of policy discussion can benefit from knowing where the jobs are being created. The entry vs. expansion distinction is useful if we think there are costs to entry. At the firm level, a decision about opening or closing establishments is very different from a decision about expanding or contracting existing establishments.
Another reason to be aware of these numbers is to have an idea about the economy's ability to both create jobs and reallocate them. We lost over 8 million jobs to the recession, but we create nearly that many every single quarter. The problem is that while some firms are creating jobs, others are destroying them--even in (especially in?) a healthy economy. This reallocation is productivity enhancing if it arises from the closure or contraction of unproductive establishments and the opening or expansion of productive ones, but it's not obvious that all of it meets those criteria. It's also not obvious whether there are costly barriers to reallocation, the absence of which would result in more of it.
In political dialogue it's common to hear phrases like "nobody wants to hire anybody" or "the job creators are all sitting on the sidelines." These numbers reveal that there is actually a lot going on in job markets, most of it hidden by net job numbers.
*The BLS effectively expanded the sample definition in the first quarter of 2013, and it does not appear that they have done anything to fix the time series. This is very unfortunate as it limits the usefulness of looking at time series in ways that are difficult to fully grasp. The 2013q1 observation was the most obviously affected, as it reported all establishments that were added to the sample as establishment openings. For openings data, I have replaced the 2013q1 observation with the average of 2012q4 and 2013q2. I haven't dug into the data enough to know whether users can manually correct for this over the longer run. See BLS discussion here, on the bottom of the page ("Administrative Change Affecting..."). Please, BLS, do something about these time series.
It is also important to note that these numbers are seasonally adjusted, and any guess at net numbers based on the difference between two seasonally adjusted series is very, very rough. Non-SA numbers are available on the BLS website.
These numbers track business establishments, which are different from firms. Costco is a firm; your local Costco store is an establishment. Most firms consist of only one establishment. The BED is not ideal for tracking firms, as it has limited ability to correctly link establishments to the firm level.