I think a lot of people sometimes think of housing as a national market. It is, in some ways. But different regions experienced substantially different house price dynamics prior to and during the Great Recession.
Figure 1 plots the FHFA house price index for North Dakota (click for larger image). Observe that this state experienced no housing bust. Several other states (DC, Oklahoma, Texas, and West Virginia) experienced more of a plateau than a decline, though they still show a slight peak and trough pattern.
![]()
Figure 1 plots the FHFA house price index for North Dakota (click for larger image). Observe that this state experienced no housing bust. Several other states (DC, Oklahoma, Texas, and West Virginia) experienced more of a plateau than a decline, though they still show a slight peak and trough pattern.
 |
| Figure 1 |
Among states that did experience declines in house prices, there is some heterogeneity in the timing of peak and trough as well as the depth of the decline. Figure 2 shows the distribution of states over peak timing; each bar indicates how many state housing markets peaked during the indicated quarter (click for larger image). I include all states but North Dakota.
 |
| Figure 2 |
Observe that most states peaked in the middle of 2007; interestingly, the national Case-Shiller index peaked in early 2006. The states peaking in 2006 include Nevada, Arizona, California, and Florida--the "sand states" that experienced the largest booms and busts led the national market by a year.
Figure 3 shows the distribution of states over trough timing--the timing of the state housing bottom (click for larger image). The data end in 2012q4, so some states may still fall further; but observe that no states were at a bottom at the end of the sample.
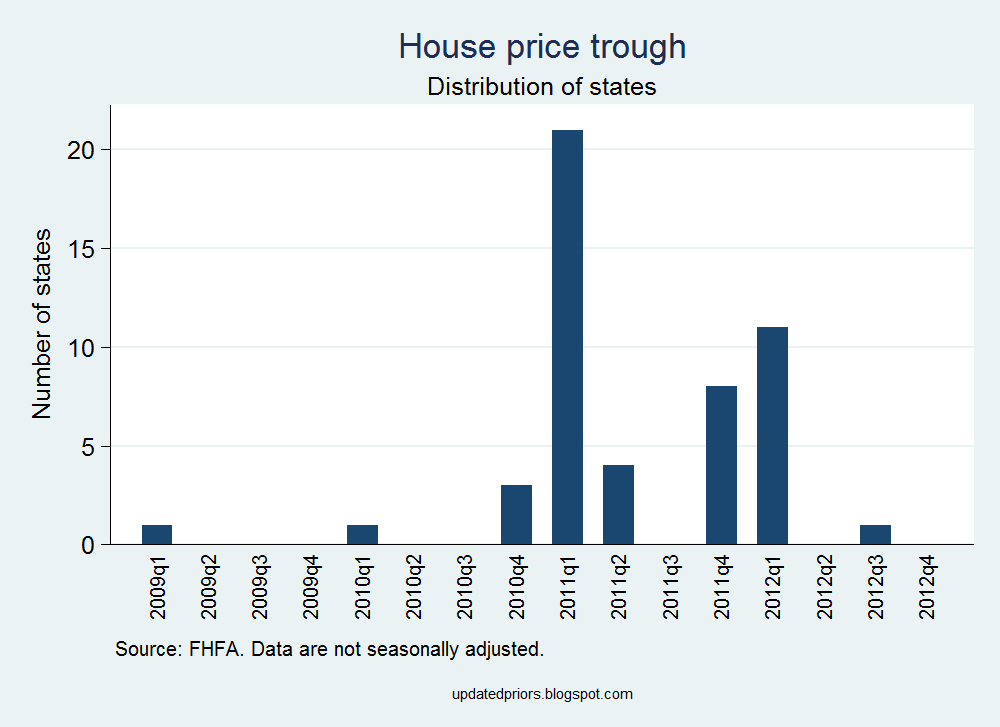 |
| Figure 3 |
Many states bottomed in early 2011, and most of the rest bottomed a year later.
The biggest differences among states were the depth of the housing market decline. Figure 4 shows peak-to-trough house price declines as a percent of the index peak, where peak and trough are defined state by state (click for larger image).
 |
| Figure 4 |
By the FHFA index, Nevada saw a stunning 60 percent decline in house prices, with the other sand states not far behind at around 50 percent. On the other hand, thirteen states experienced declines of less than 10 percent.
The housing collapse was a few states--accounting for a nontrivial portion of the national housing market--beginning to dive in mid-2006, with most other states following a full year later. The early states saw the largest price declines. The price collapse ended for most states in 2011, with real growth just now starting to return. This variation in both the timing and the depth of the crisis is a reminder that housing markets are regional, but the fact that nearly every state experienced some degree of decline is telling.